All the World’s Metals and Minerals in One Visualization
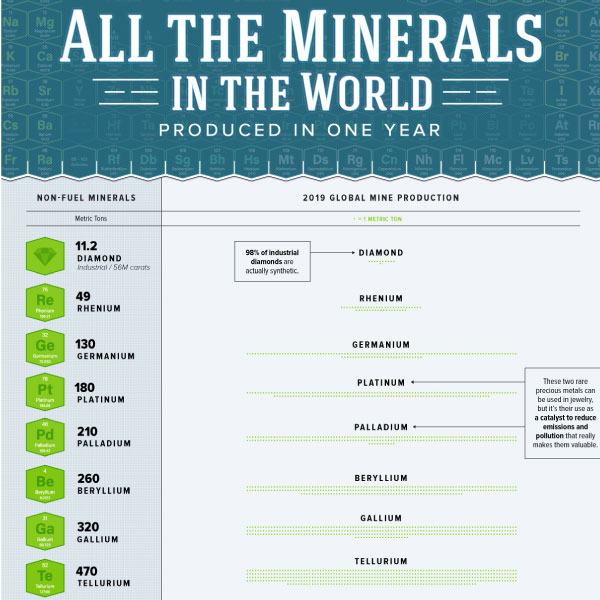
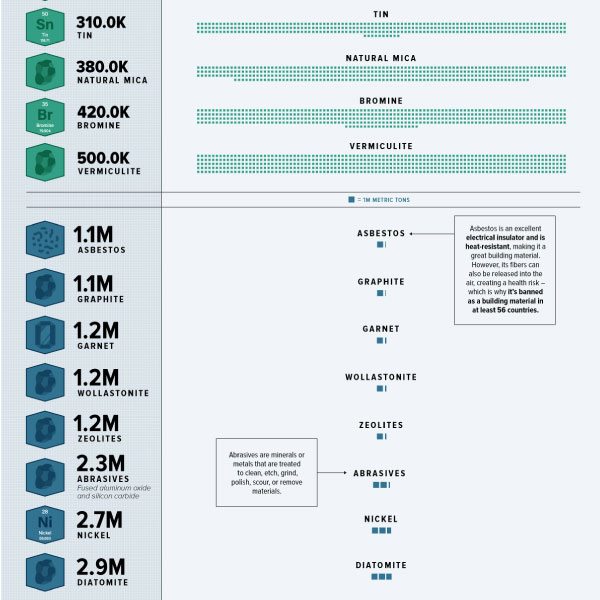
We live in a material world, in that we rely on materials to make our lives better. Without even realizing it, humans consume enormous amounts of metals and minerals with every convenient food package, impressive building, and technological innovation.
Every year, the United States Geological Service (USGS) publishes commodity summaries outlining global mining statistics for over 90 individual minerals and materials. This infographic visualizes the data to reveal the dramatic scale of 2019 non-fuel mineral production.
First published: March 1, 2020 (link)
Source files included: .ai, .eps, .pdf
Data source: Mineral Commodity Summaries 2020 – USGS, University of Waterloo
A full license grants you the permission to download and modify our visualization, and to re-publish it in most professional and personal use cases.
Licenses also give you permission to translate our visualizations into another language, provided that you also remove the Visual Capitalist branding.
| Type of License | Full License (1 Credit) |
|---|


