
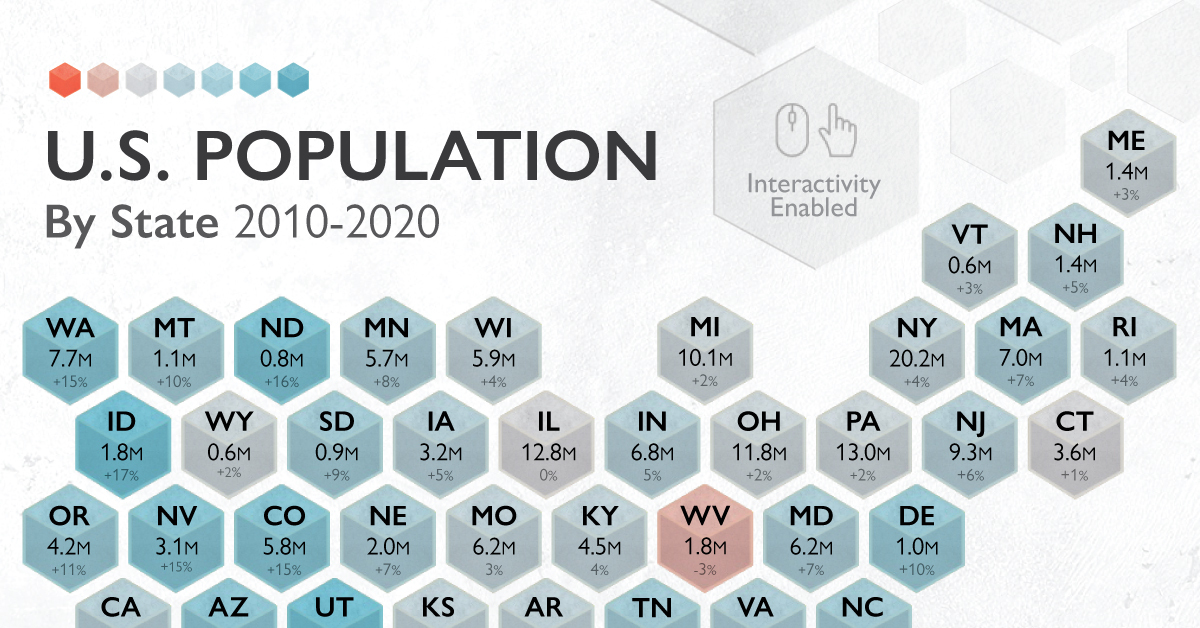
How the U.S. Population Has Changed in 10 Years, by State
The U.S. saw population growth of 7.4% over the past decade, the lowest it’s been since the 1930s. How does population by state look today?
First published: July 13, 2021 (link)
Source files included: .ai, .eps .pdf
Data source: U.S. Census Bureau (2021), Brookings
A full license grants you the permission to download and modify our visualization, and to re-publish it in most professional and personal use cases.
Licenses also give you permission to translate our visualizations into another language, provided that you also remove the Visual Capitalist branding.
| Type of License | Full License (1 Credit) |
|---|

