
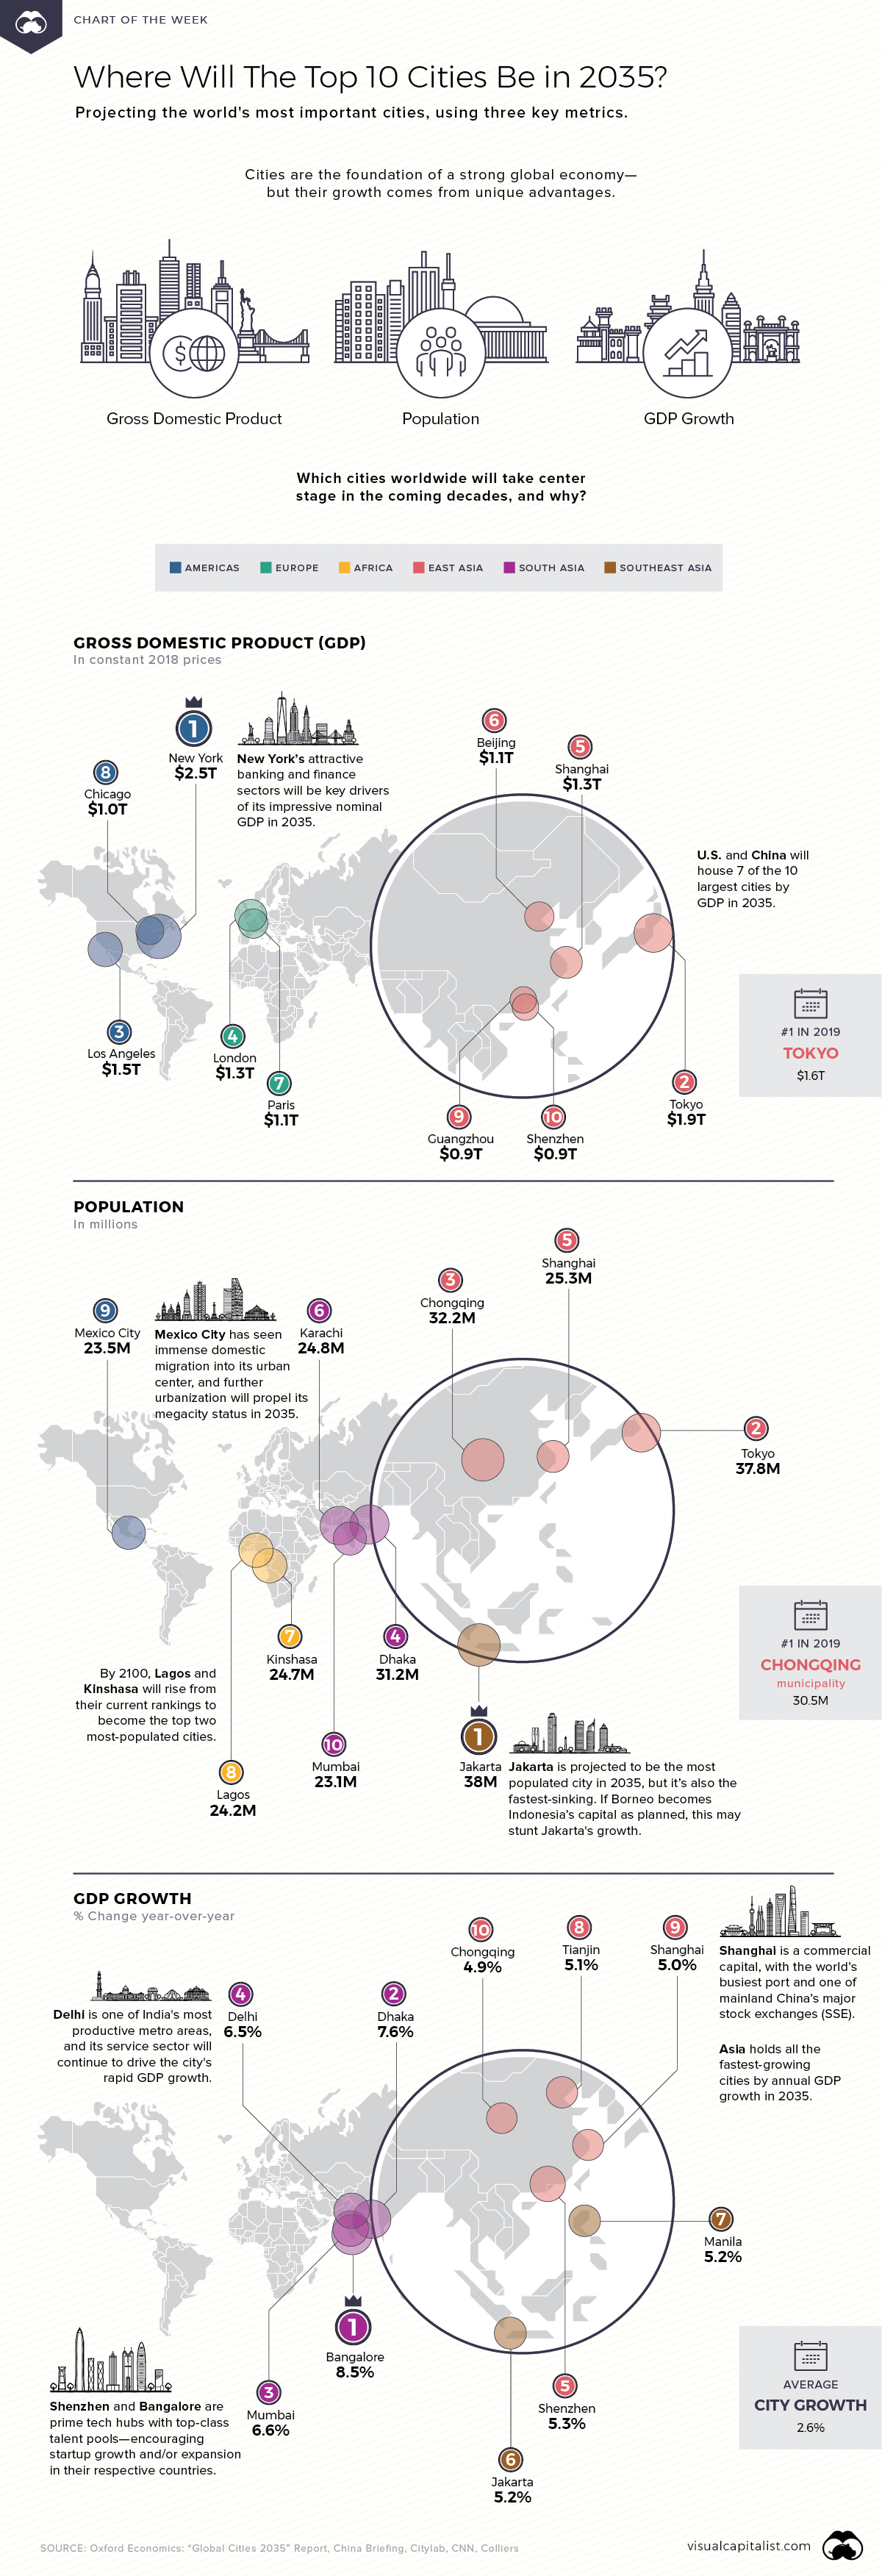
Mapped: The World’s Top 10 Cities in 2035
Cities are heavy hitters in the global economy. Where will the top 10 cities be in 2035—based on GDP, population, and annual growth?
First published: October 18, 2019 (link)
Source files included: .ai, .eps, .pdf
Data source: Oxford Economics: “Global Cities 2035” Report, China Briefing, Citylab, CNN, Colliers
A full license grants you the permission to download and modify our visualization, and to re-publish it in most professional and personal use cases.
Licenses also give you permission to translate our visualizations into another language, provided that you also remove the Visual Capitalist branding.
| Type of License | Full License (1 Credit) |
|---|

