The COVID-19 Impact on App Popularity
Pandemic-induced social isolation has altered the relationship consumers have with technology.
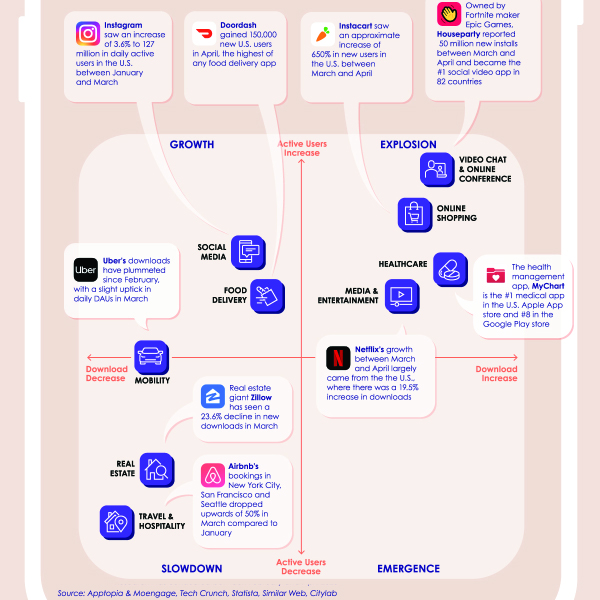
With the physical world now slowly receding, consumers are suddenly more reliant on apps for communication, shopping, staying healthy, and entertainment.
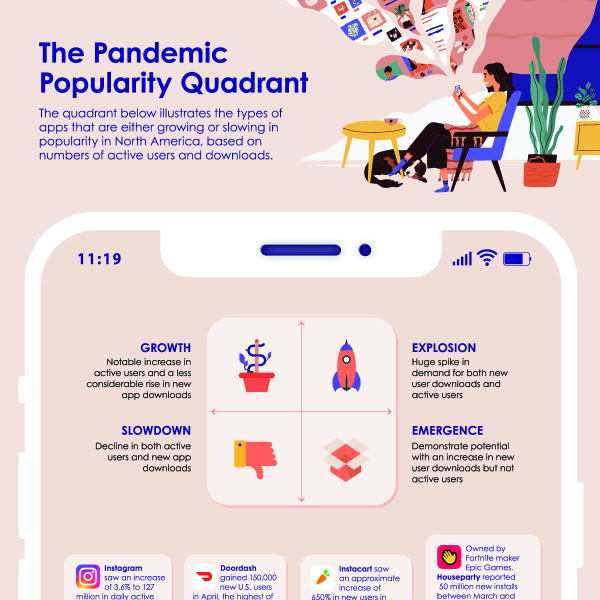
This infographic pulls data from a new report by MoEngage and Apptopia, and it plots the winners and losers of the pandemic from the app world in North America.
First published: May 4, 2020 (link)
Source files included: .ai, .eps, .pdf
Data source: MoEngage, Apptopia
A full license grants you the permission to download and modify our visualization, and to re-publish it in most professional and personal use cases.
Licenses also give you permission to translate our visualizations into another language, provided that you also remove the Visual Capitalist branding.
| Type of License | Full License (1 Credit) |
|---|


