


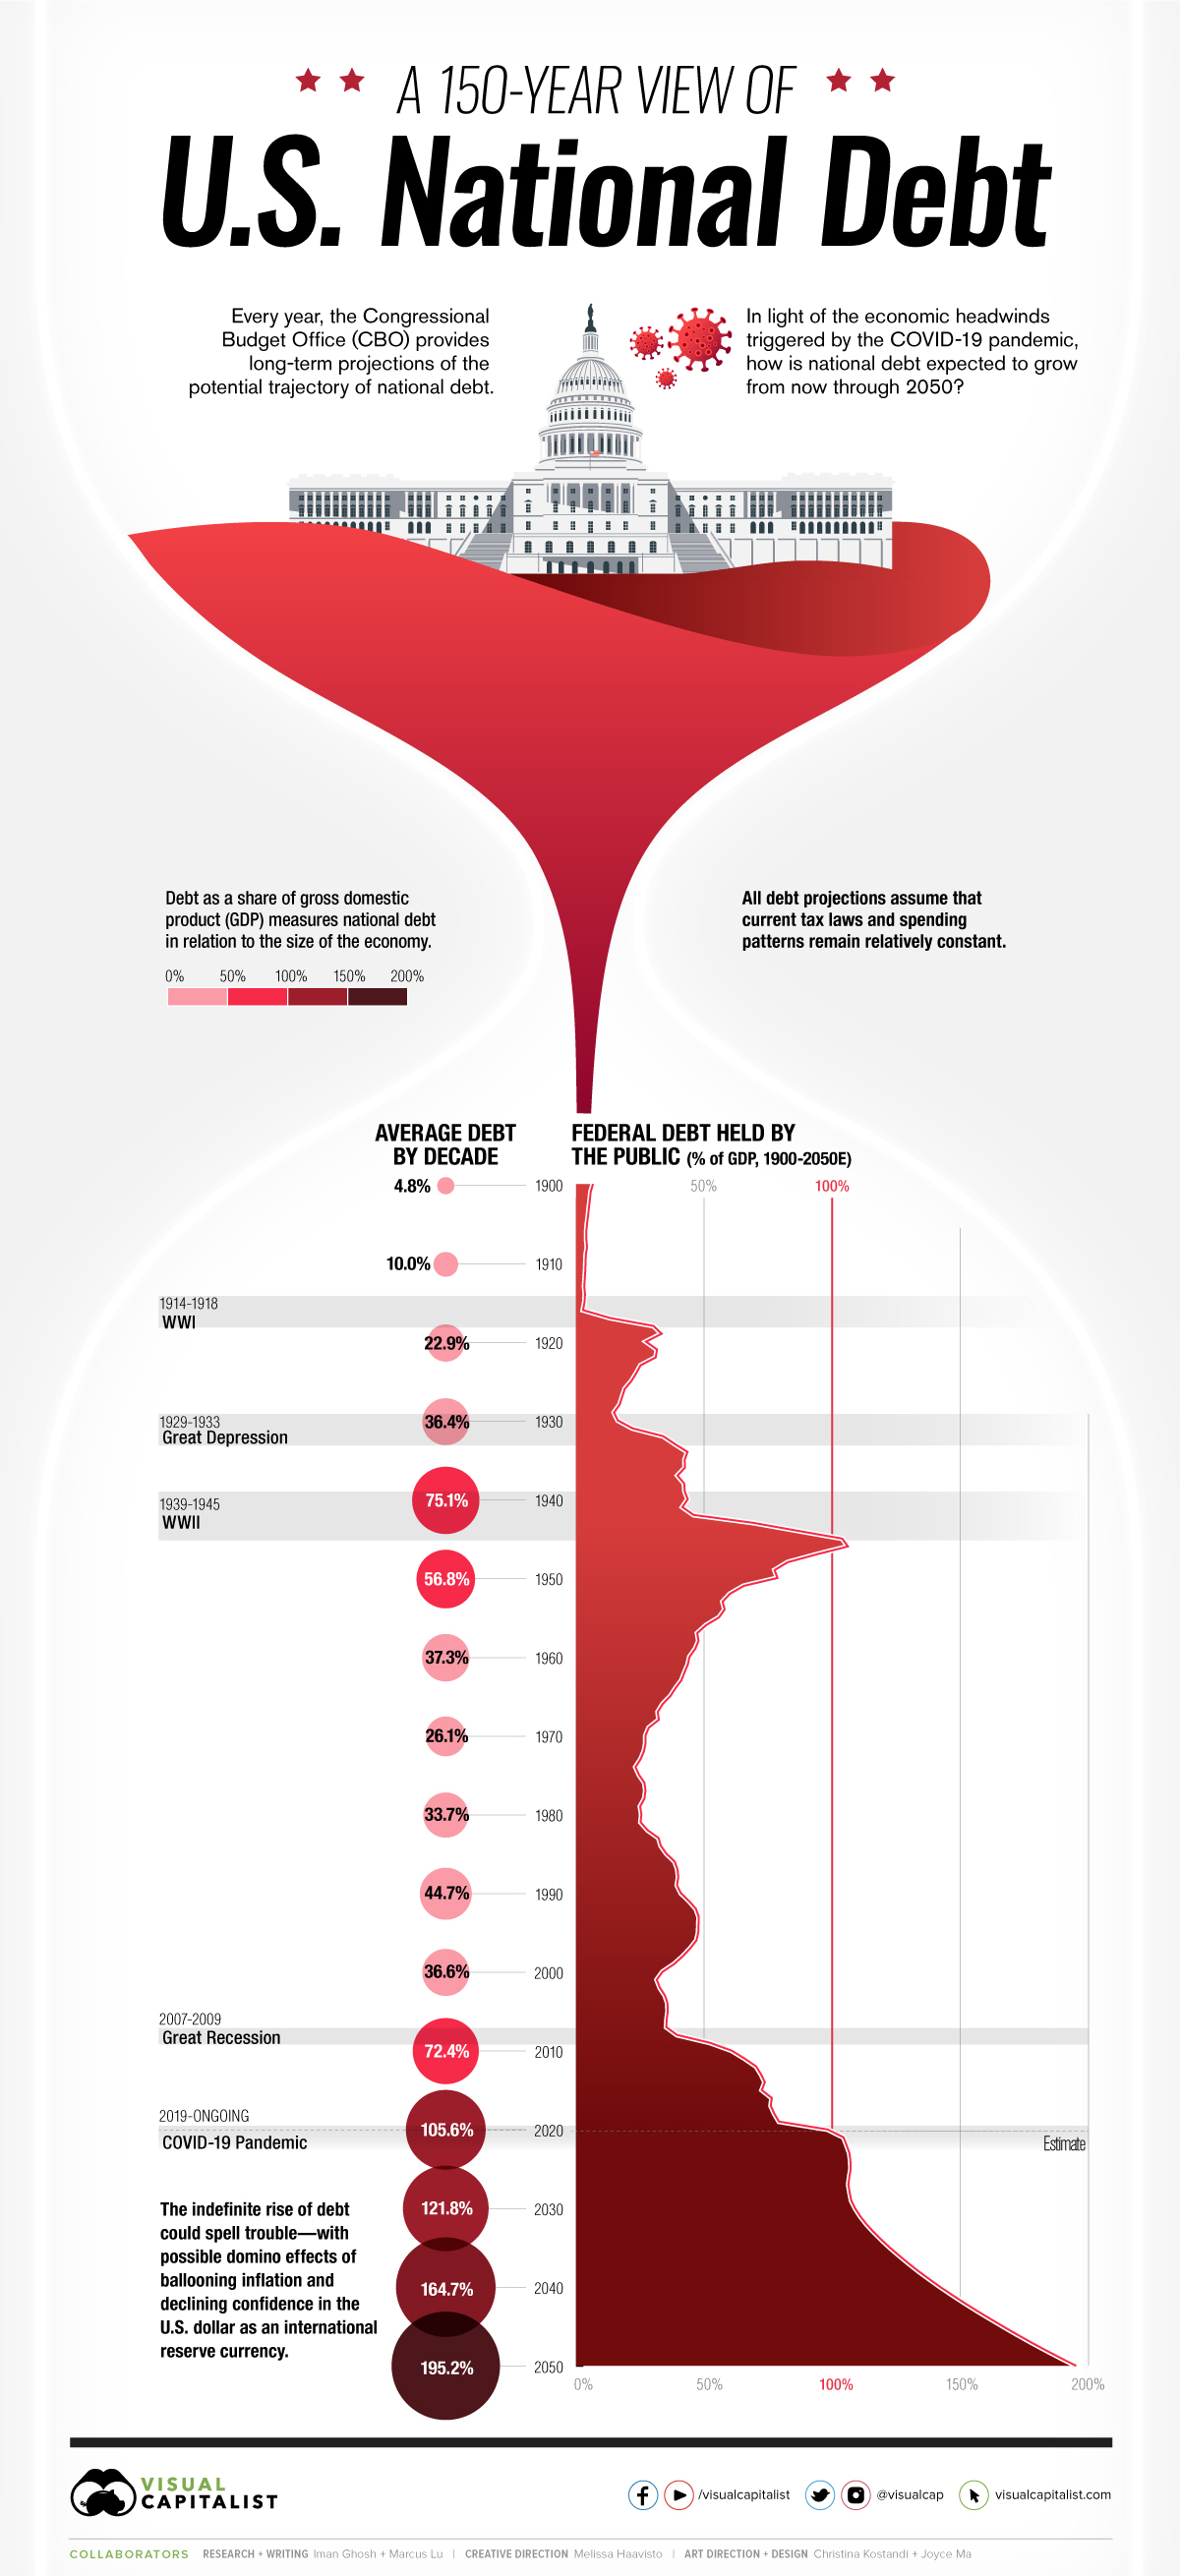
Timeline: 150 Years of U.S. National Debt
This interactive visual shows how the U.S. national debt has fluctuated since 1900, as well as projections all the way to 2050.
First published: June 21, 2021 (link)
Source files included: .ai, .eps, .pdf
Data source: Congressional Budget Office (CBO)
A full license grants you the permission to download and modify our visualization, and to re-publish it in most professional and personal use cases.
Licenses also give you permission to translate our visualizations into another language, provided that you also remove the Visual Capitalist branding.
| Type of License | Full License (1 Credit) |
|---|

