
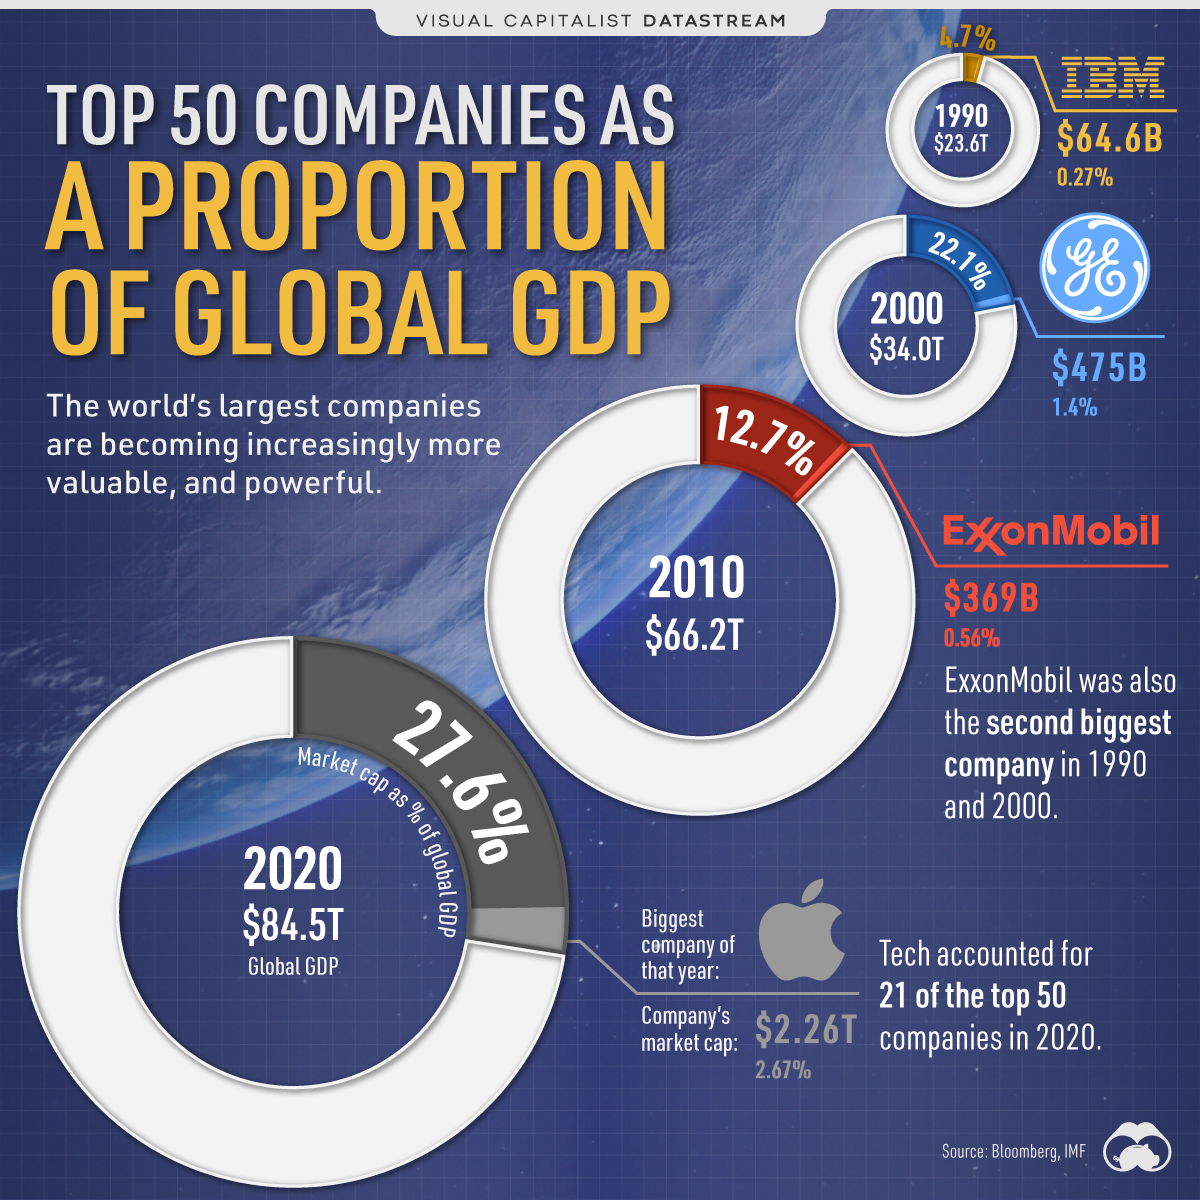
Top 50 Companies Proportion of World GDP
The world’s top 50 companies are becoming more valuable, especially compared to global GDP. Here’s how they’ve grown in proportion.
First published: July 19, 2021 (link)
Source files included: .ai, .eps .pdf
Data source: Bloomberg, IMF
A full license grants you the permission to download and modify our visualization, and to re-publish it in most professional and personal use cases.
Licenses also give you permission to translate our visualizations into another language, provided that you also remove the Visual Capitalist branding.
| Type of License | Full License (1 Credit) |
|---|

