Visualized: A Snapshot of the Global Personal Tech Market
For many, it’s become difficult to function in day-to-day life without the use of a mobile phone. The average American checks their phone 96 times a day—that’s once every 10 minutes.
But it’s not just mobile phones that have become increasingly intertwined with our everyday lives. A plethora of accessories and devices, known as smartphone multipliers, have surged in popularity—this market is set to generate $459 billion in revenue by the end of 2020.
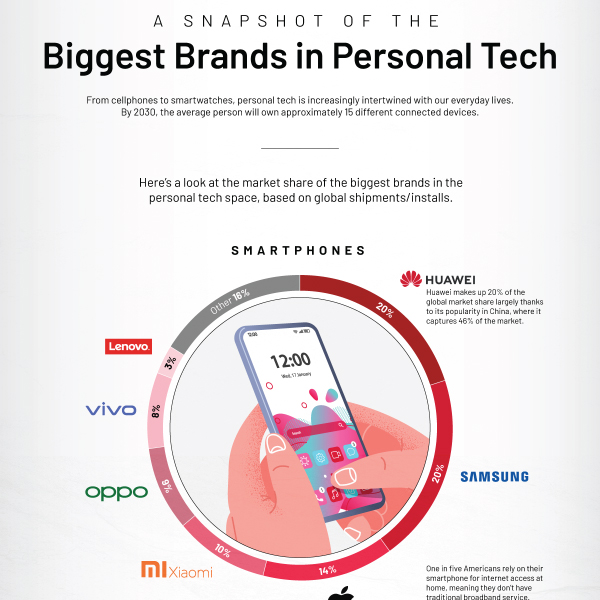
Which brands are capitalizing on this lucrative market? This infographic provides a snapshot of the leading tech brands currently dominating the personal tech space, based on the most recent global market share data on shipments and installs.
First published: October 2, 2020 (link)
Source files included: .ai, .eps, .pdf
Data source: Martech Advisor, Neowin, Statcounter, Bloomberg, Counterpoint Technology Market Research
A full license grants you the permission to download and modify our visualization, and to re-publish it in most professional and personal use cases.
Licenses also give you permission to translate our visualizations into another language, provided that you also remove the Visual Capitalist branding.
| Type of License | Full License (1 Credit) |
|---|


