Tracking the Growing Wave of Oil & Gas Bankruptcies in 2020
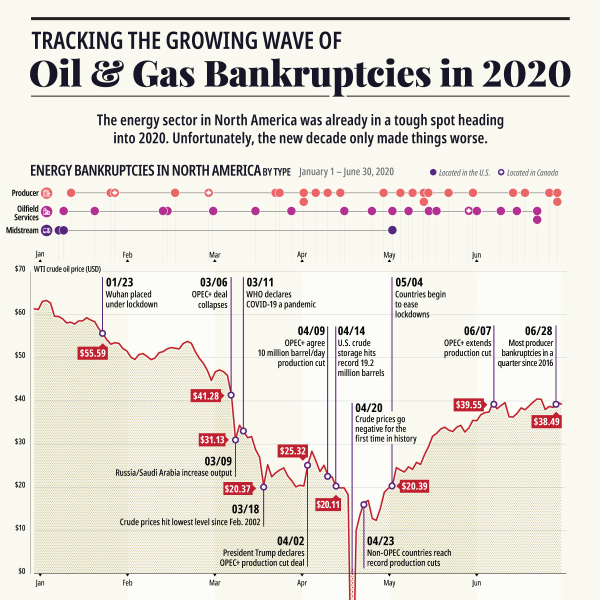
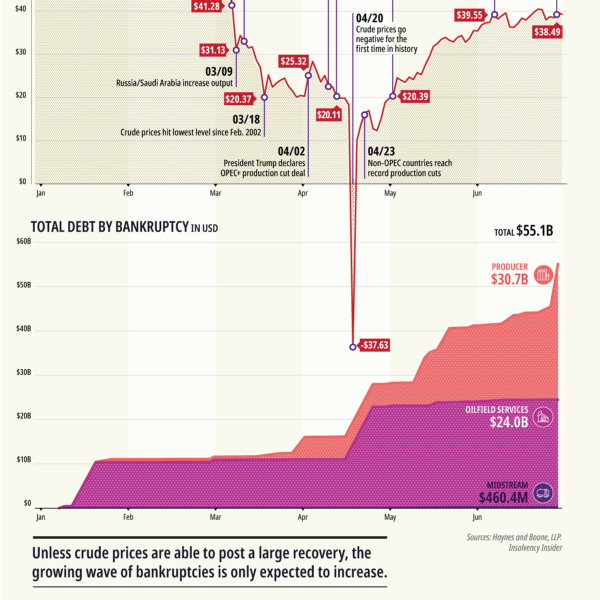
2020 hasn’t been kind to the energy sector, and a growing wave of energy bankruptcies has started to build.
After a difficult year marred by rising geopolitical tensions in the Middle East and crude prices in the $50-60 per barrel range, analysts warned that the energy sector needed a strong recovery to offset a rising (and expiring) mountain of debt.
Instead, the oil patch has seen one bombshell after another, and the impacts are adding up.
First published: July 24, 2020 (link)
Source files included: .ai, .eps, .pdf
Data source: Haynes and Boone LLP., Insolvency Insider
A full license grants you the permission to download and modify our visualization, and to re-publish it in most professional and personal use cases.
Licenses also give you permission to translate our visualizations into another language, provided that you also remove the Visual Capitalist branding.
| Type of License | Full License (1 Credit) |
|---|


