
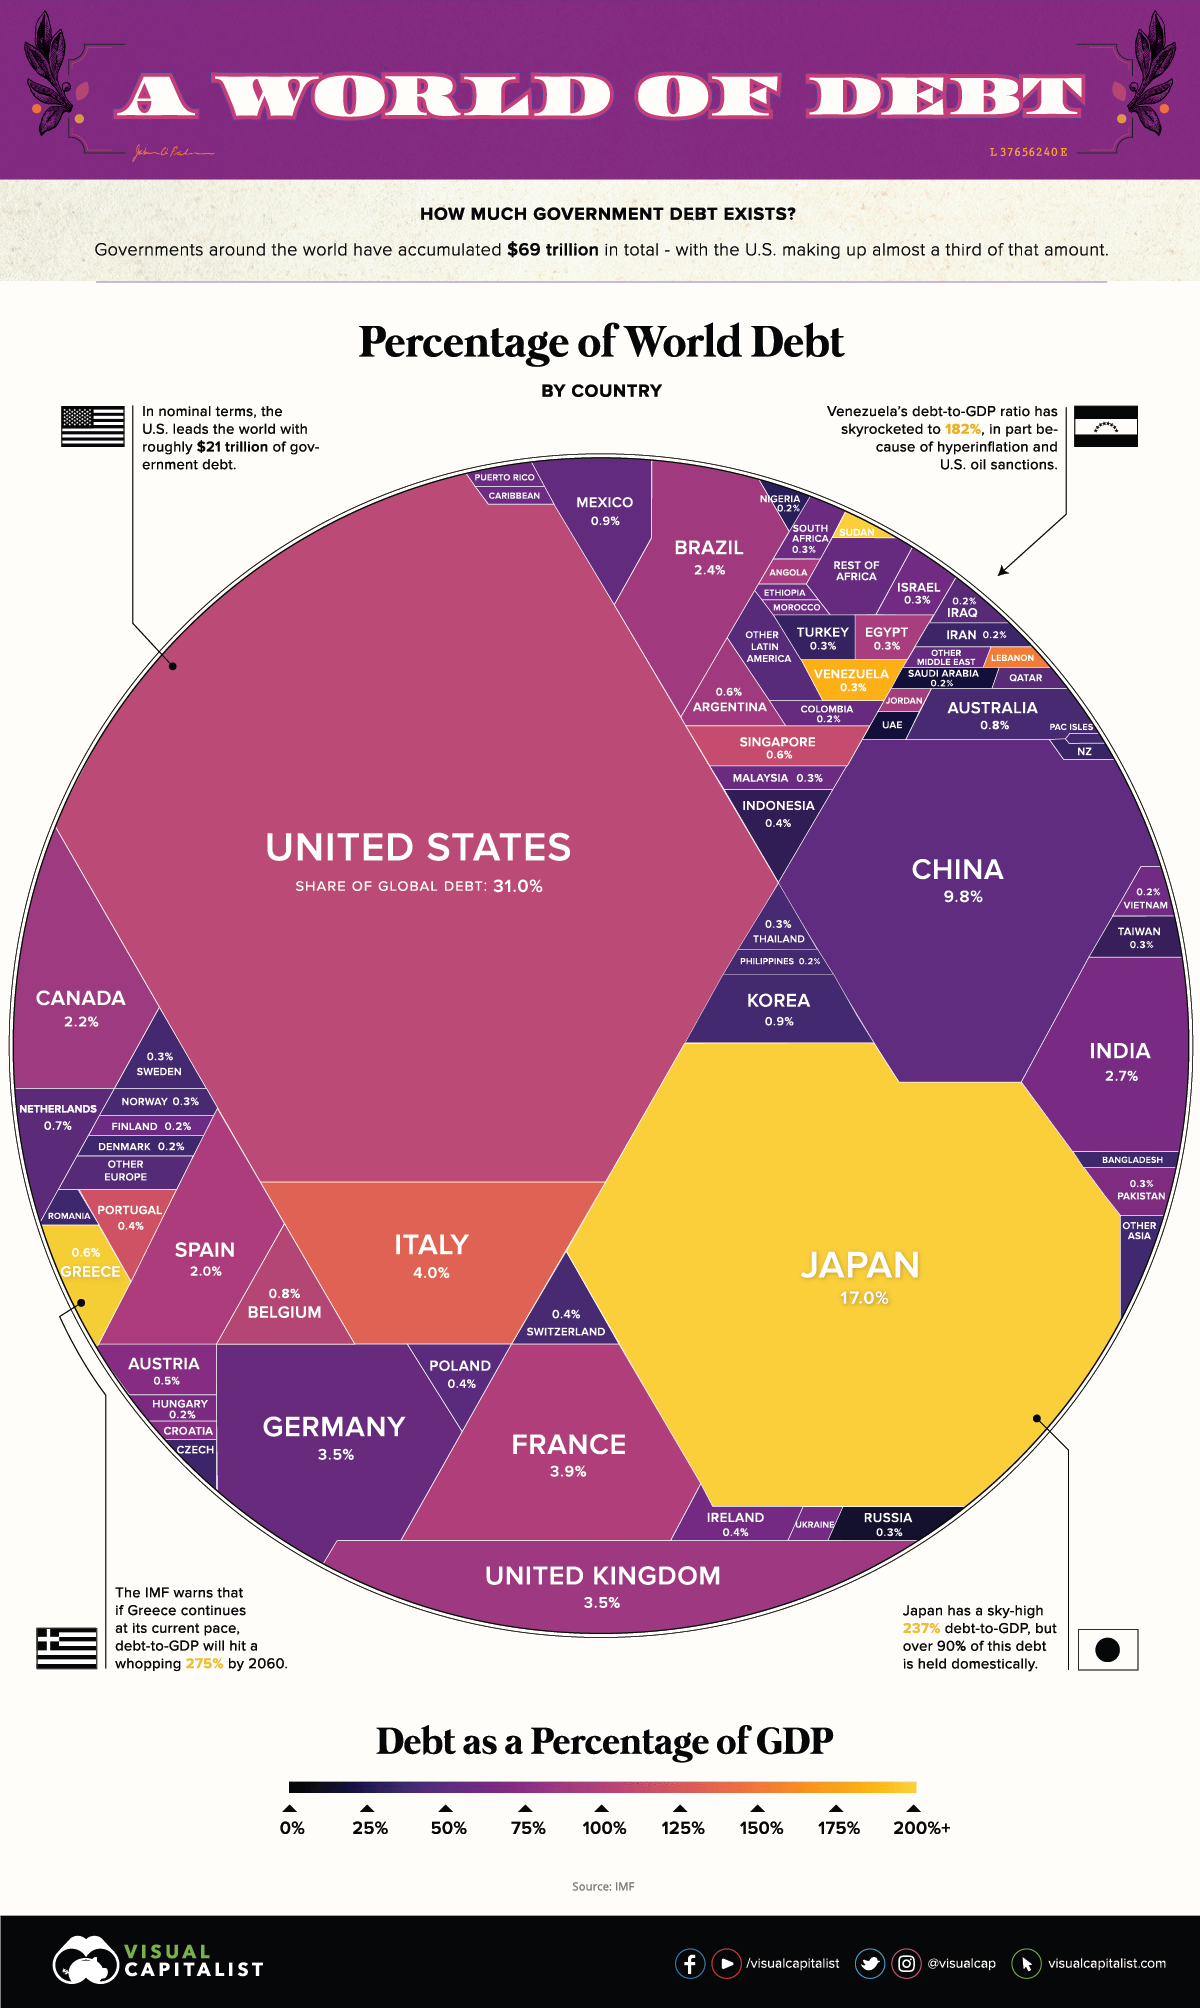
$69 Trillion of World Debt in One Infographic
Two decades ago, total government debt was estimated to sit at $20 trillion.
Since then, according to the latest figures by the IMF, the number has ballooned to $69.3 trillion with a debt to GDP ratio of 82% — the highest totals in human history.
Which countries owe the most money, and how do these figures compare?
First published: November 14, 2019 (link)
Source files included: .ai, .eps, .pdf
Data source: IMF
A full license grants you the permission to download and modify our visualization, and to re-publish it in most professional and personal use cases.
Licenses also give you permission to translate our visualizations into another language, provided that you also remove the Visual Capitalist branding.
| Type of License | Full License (1 Credit) |
|---|

