
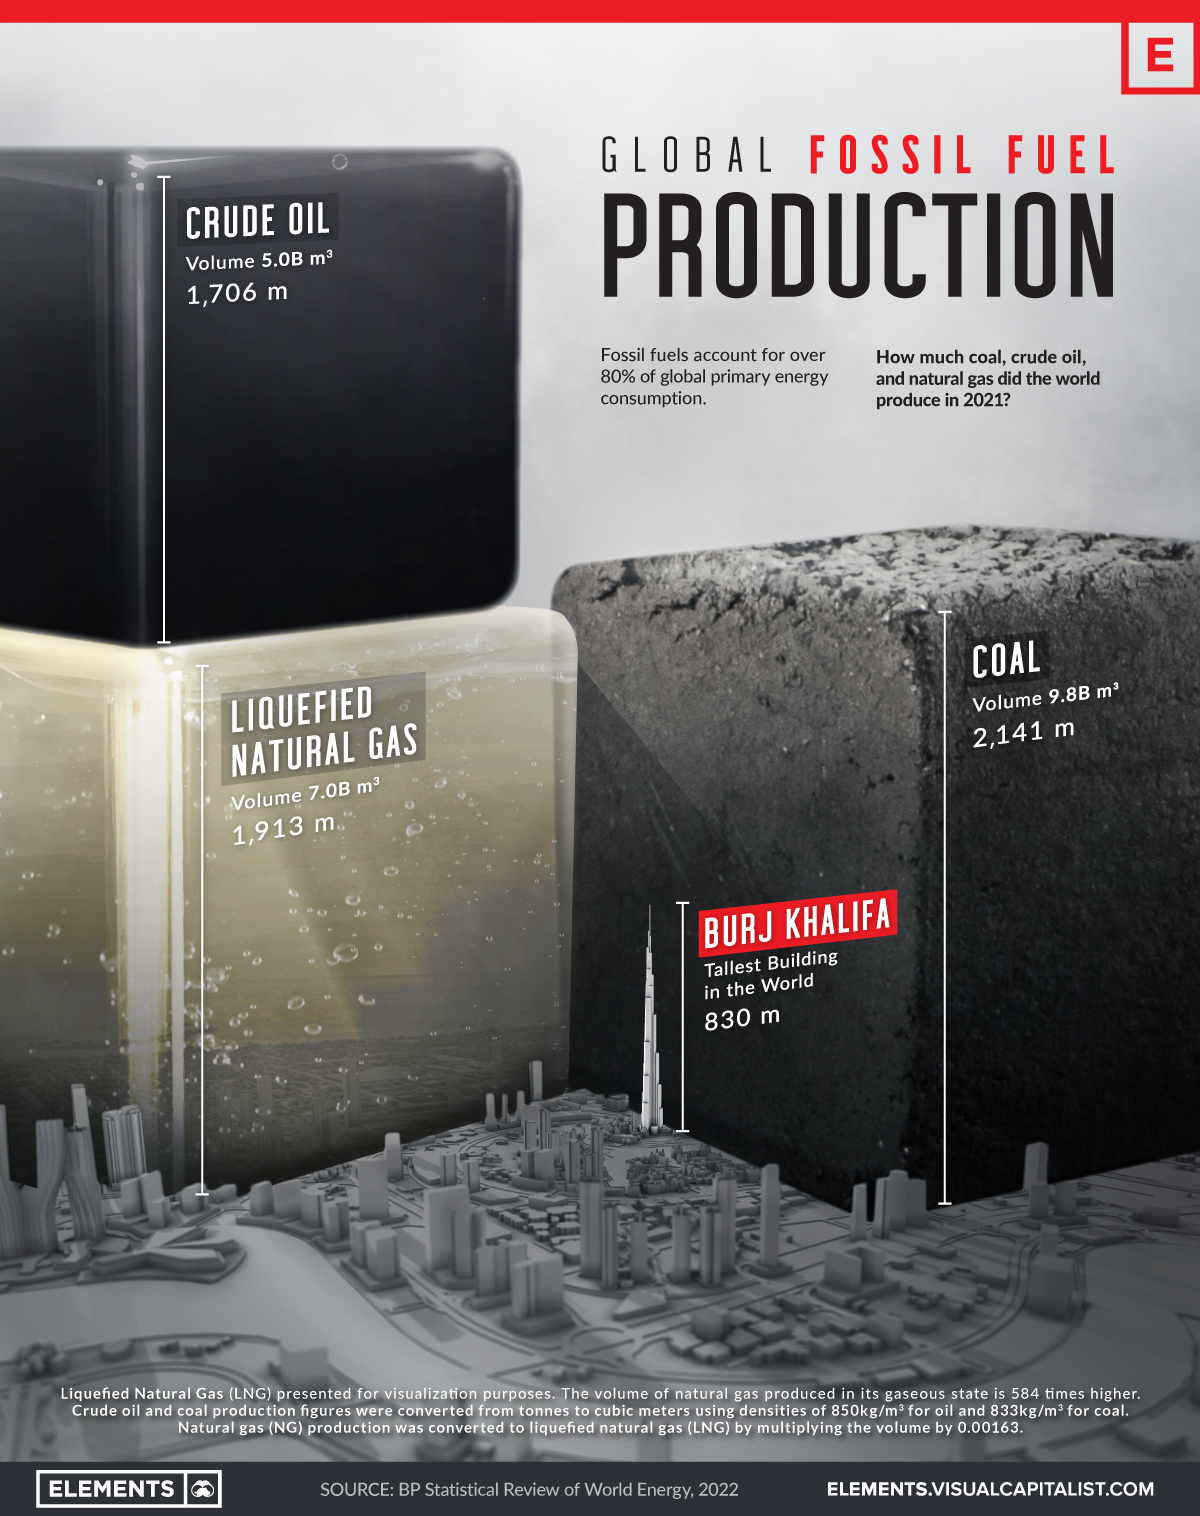
Visualizing the Scale of Global Fossil Fuel Production
How much oil, coal, and natural gas do we extract each year? See the scale of annual fossil fuel production in perspective.
First published: January 31, 2023 (link)
Source files included: .ai, .pdf
Data source: BP Statistical Review of World Energy, 2022
A full license grants you the permission to download and modify our visualization, and to re-publish it in most professional and personal use cases.
Licenses also give you permission to translate our visualizations into another language, provided that you also remove the Visual Capitalist branding.
| Type of License | Full License (1 Credit) |
|---|

