

Visualizing the Life Cycle of a Mineral Discovery
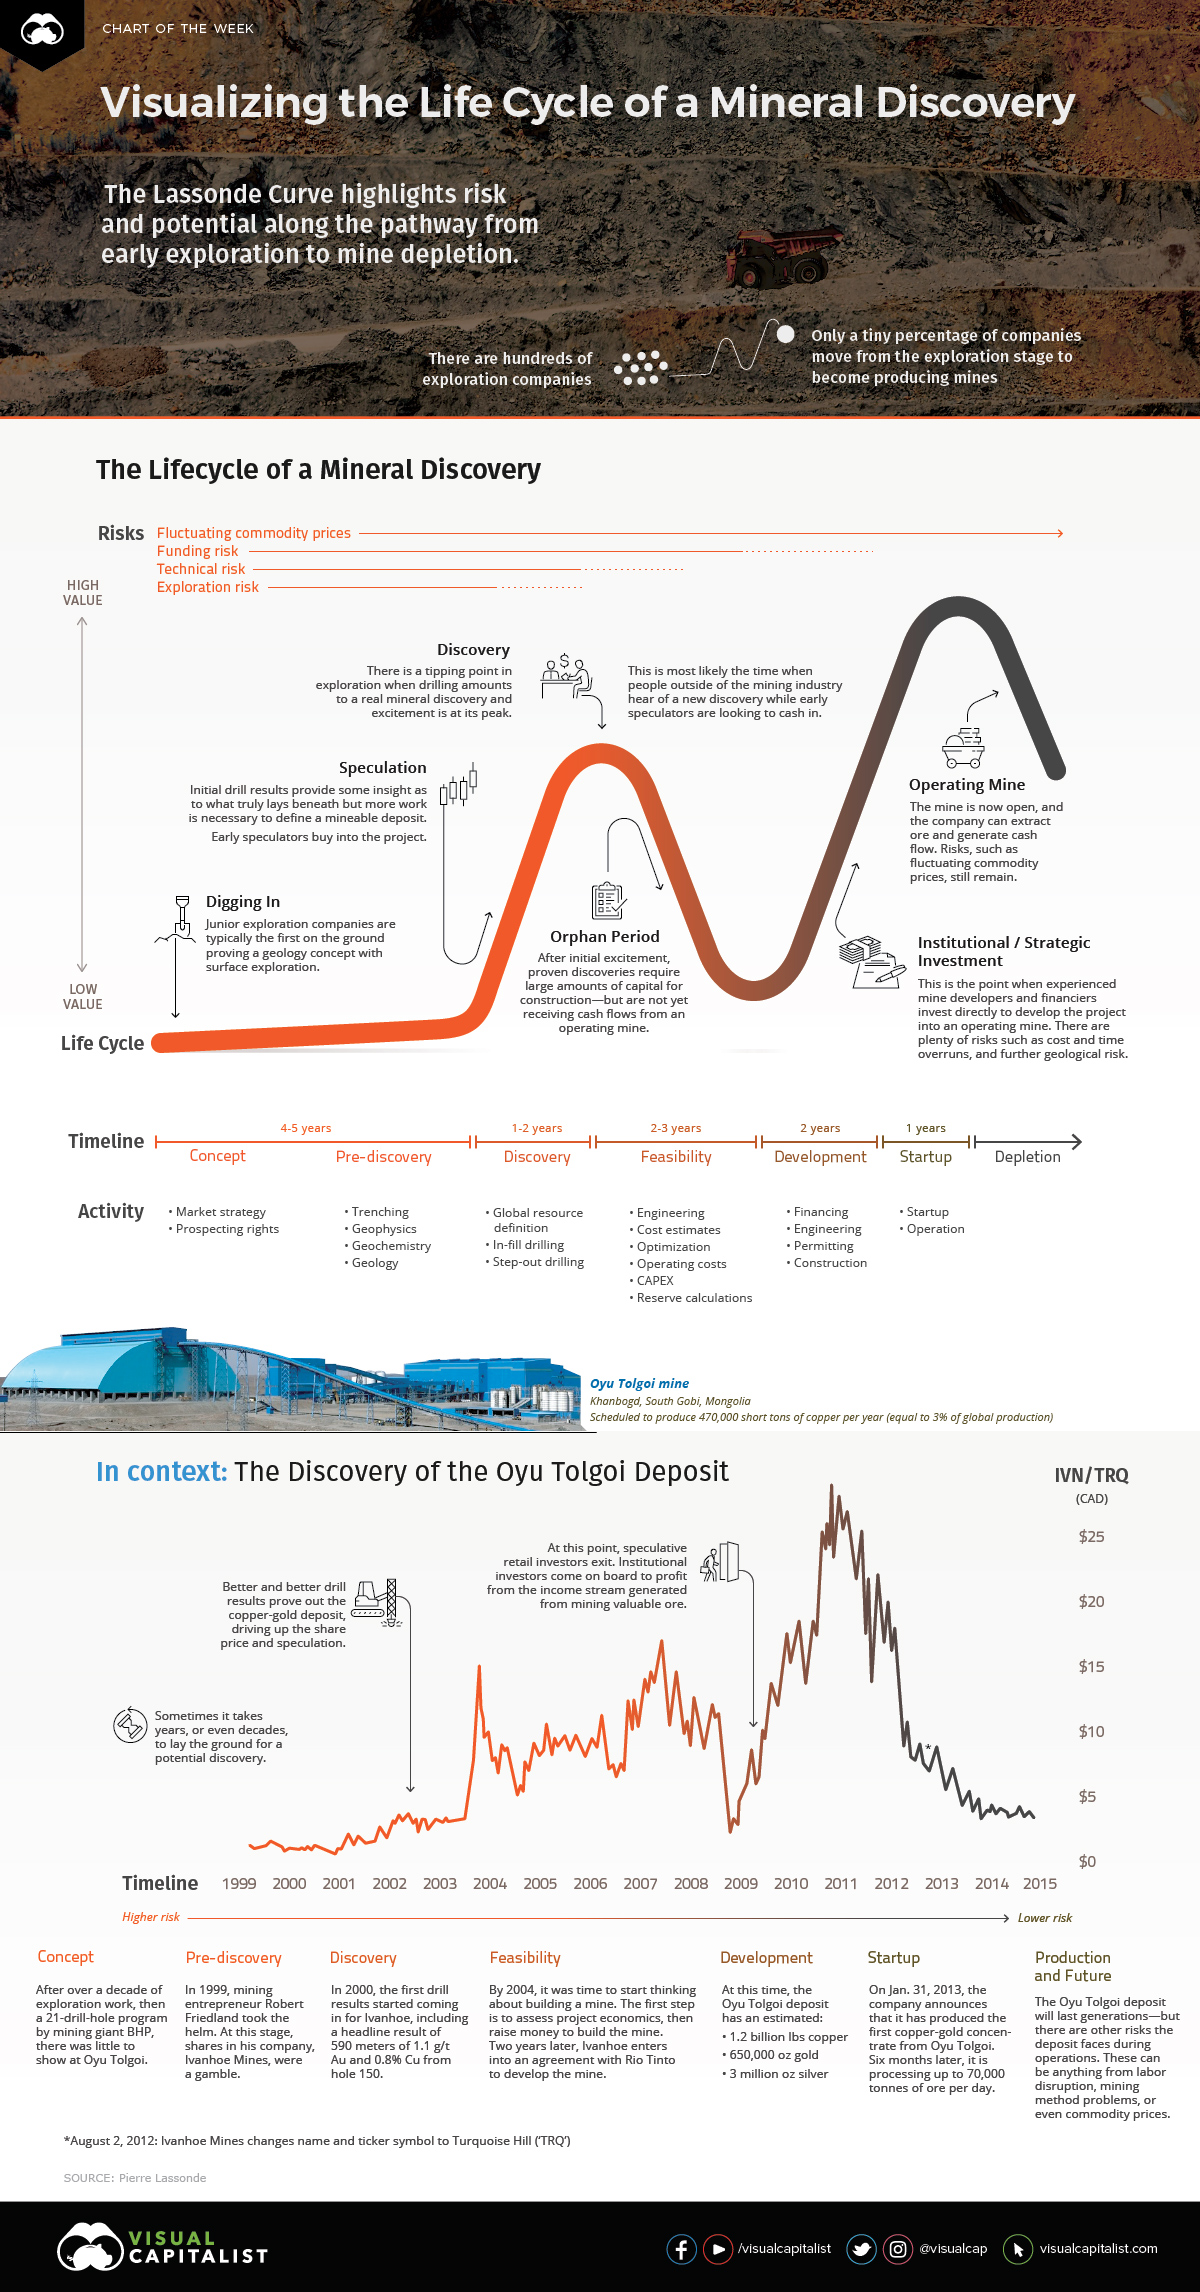
Building a mine takes time that poses risks at every stage. This graphic maps a mineral deposit from discovery to mining, showing where value is created.
First published: September 12, 2019 (link)
Source files included: .ai, .eps, .pdf
Data source: Pierre Lassonde
A full license grants you the permission to download and modify our visualization, and to re-publish it in most professional and personal use cases.
Licenses also give you permission to translate our visualizations into another language, provided that you also remove the Visual Capitalist branding.
| Type of License | Full License (1 Credit) |
|---|

