


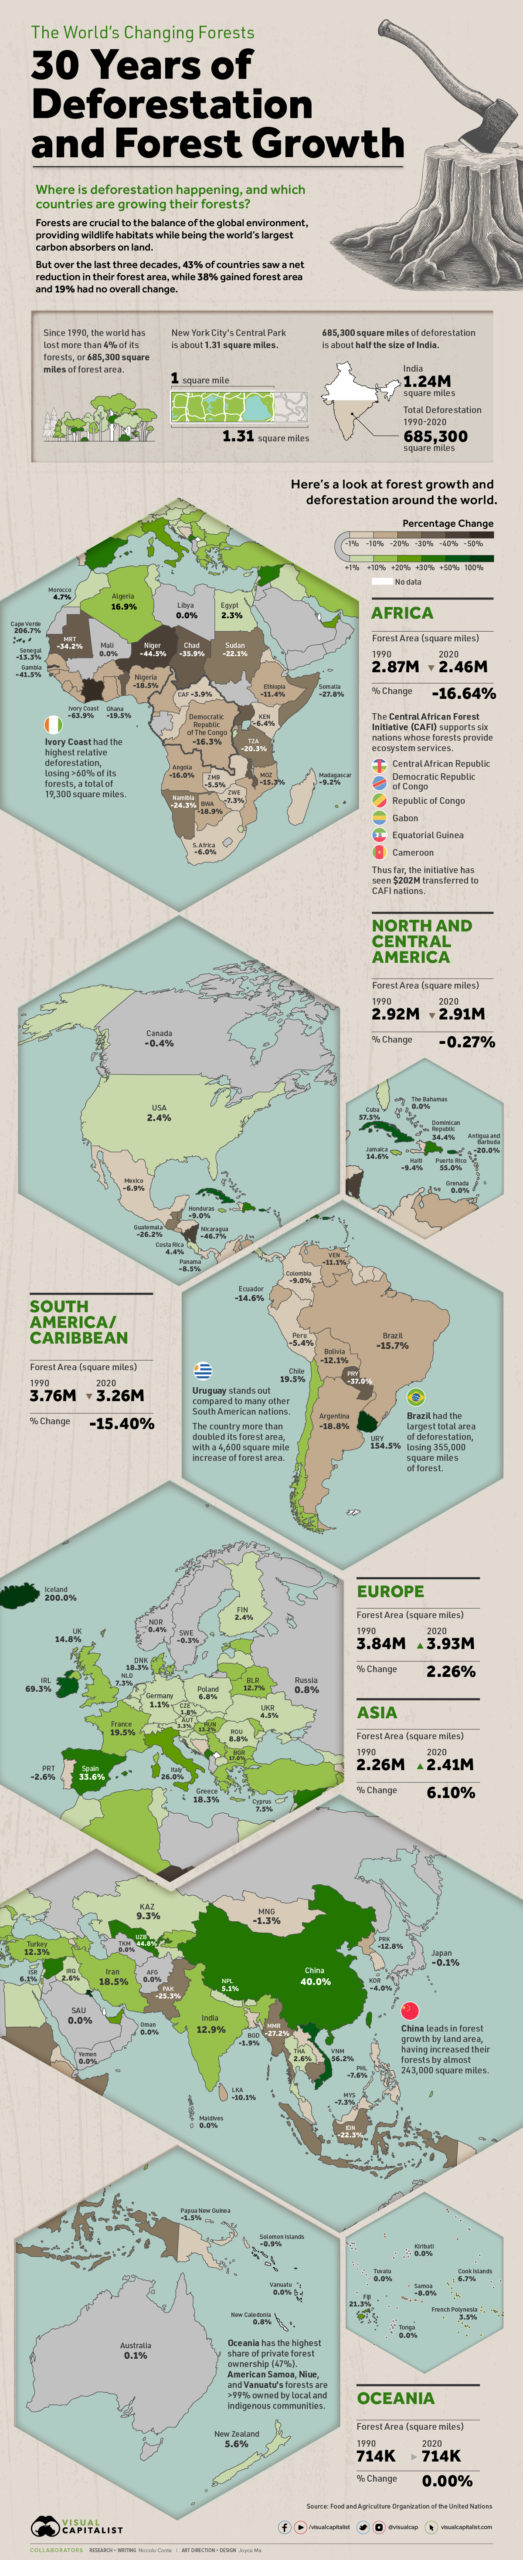
Mapped: 30 Years of Deforestation and Forest Growth, by Country
Where are the world’s forests still shrinking, and where are they seeing net gains? We map deforestation by country between 1990-2020.
First published: December 29, 2021 (link)
Source files included: .ai, .eps, .pdf
Data source: United Nations FAO
A full license grants you the permission to download and modify our visualization, and to re-publish it in most professional and personal use cases.
Licenses also give you permission to translate our visualizations into another language, provided that you also remove the Visual Capitalist branding.
| Type of License | Full License (1 Credit) |
|---|

