Visualizing the U.S. Population by Race
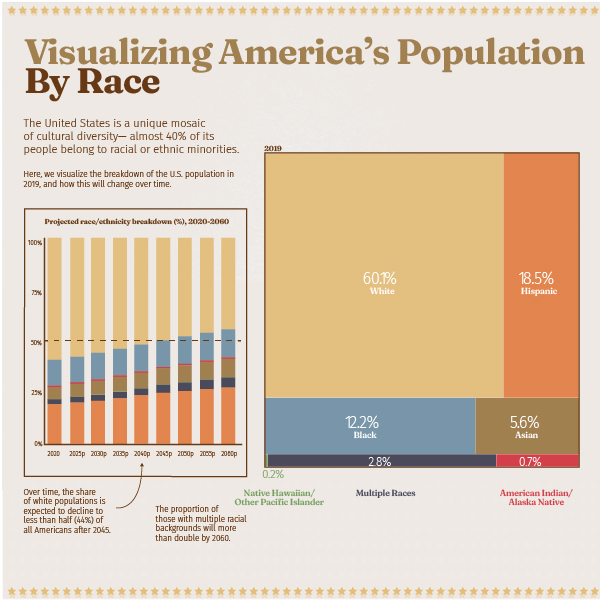
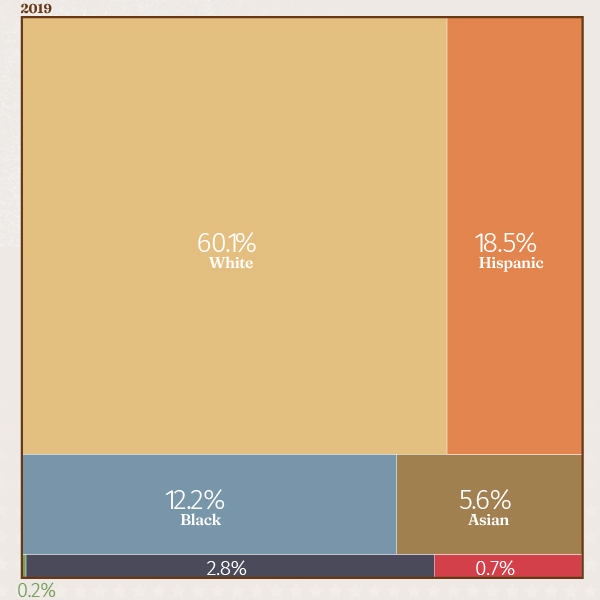
The American population is a unique mosaic of cultures—and almost 40% of people identify as racial or ethnic minorities today.
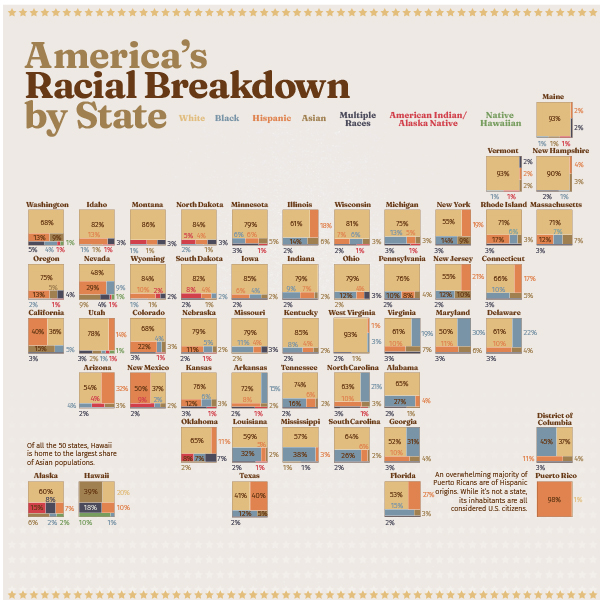
In this treemap, we use data for 2019 from the Kaiser Family Foundation, which bases its analysis on the latest American Community Survey (ACS) data from the U.S. Census Bureau. Then we break down the same data on a state-by-state basis.
First published: December 28, 2020 (link)
Source files included: .ai, .eps, .pdf
Data source: Kaiser Family Foundation, U.S. Census Bureau
A full license grants you the permission to download and modify our visualization, and to re-publish it in most professional and personal use cases.
Licenses also give you permission to translate our visualizations into another language, provided that you also remove the Visual Capitalist branding.
| Type of License | Full License (1 Credit) |
|---|


