

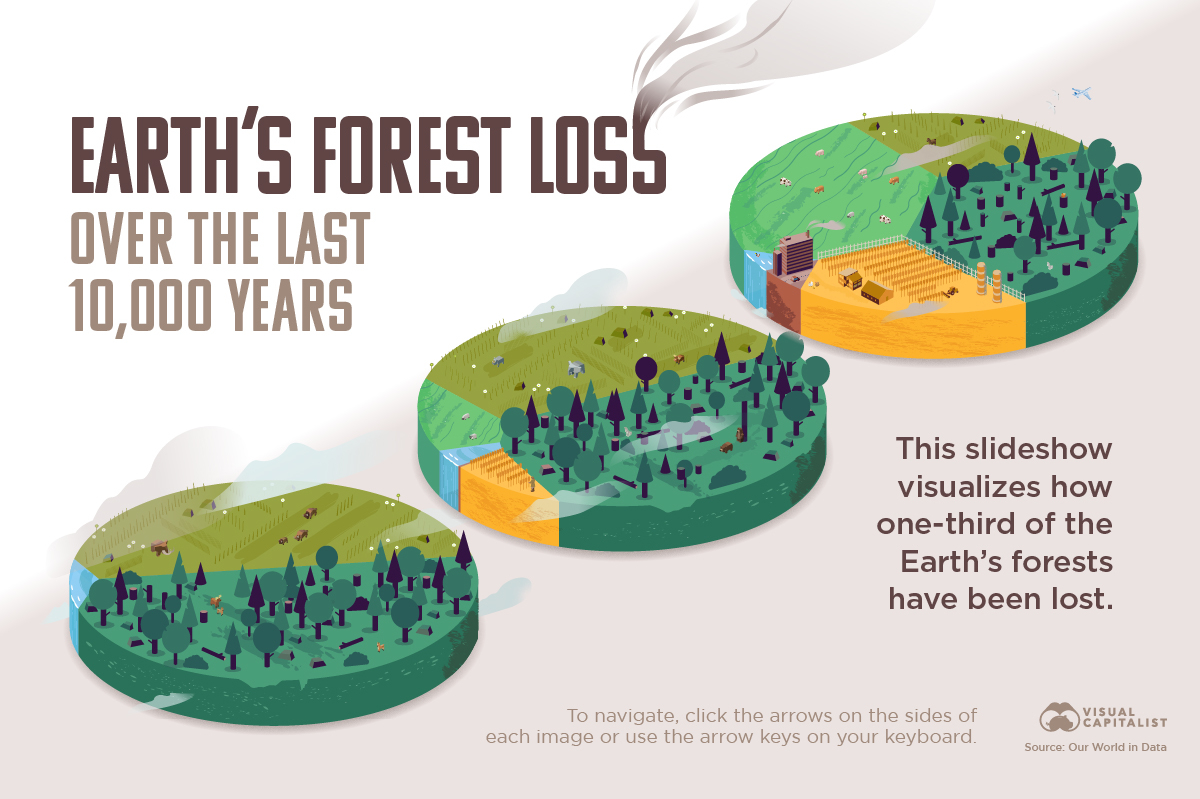
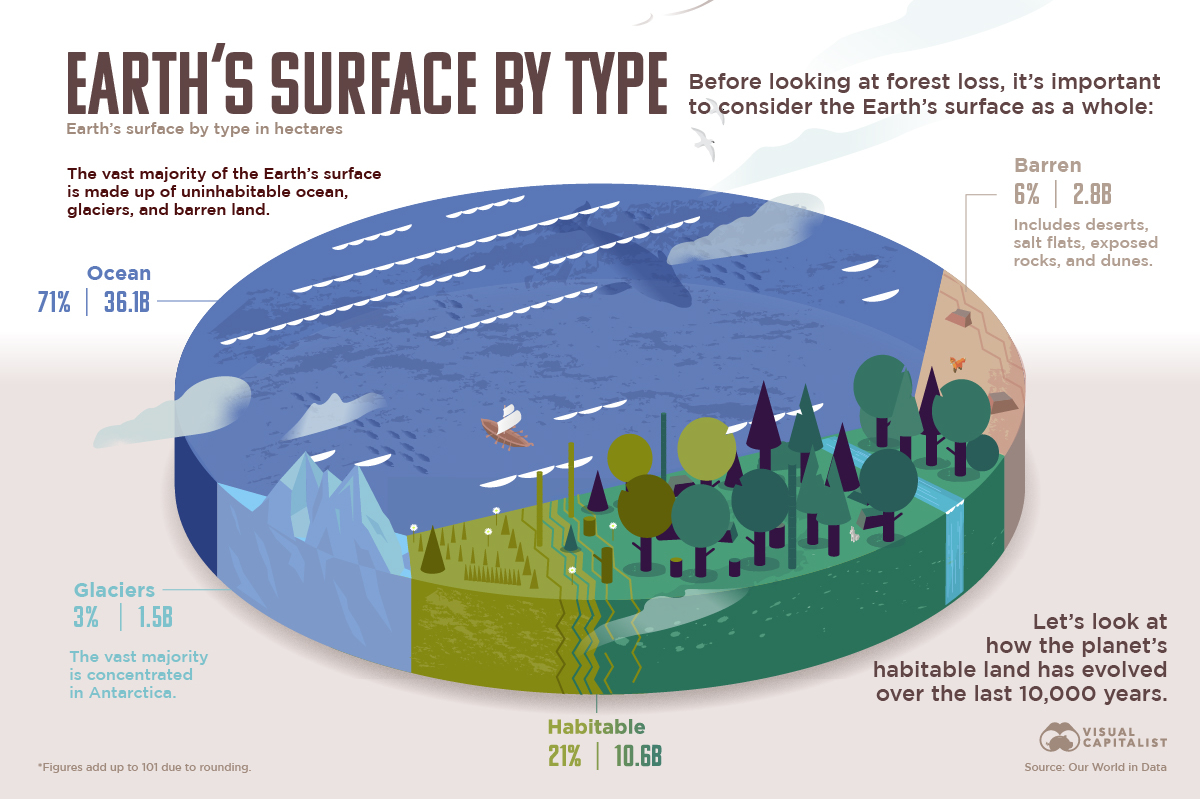
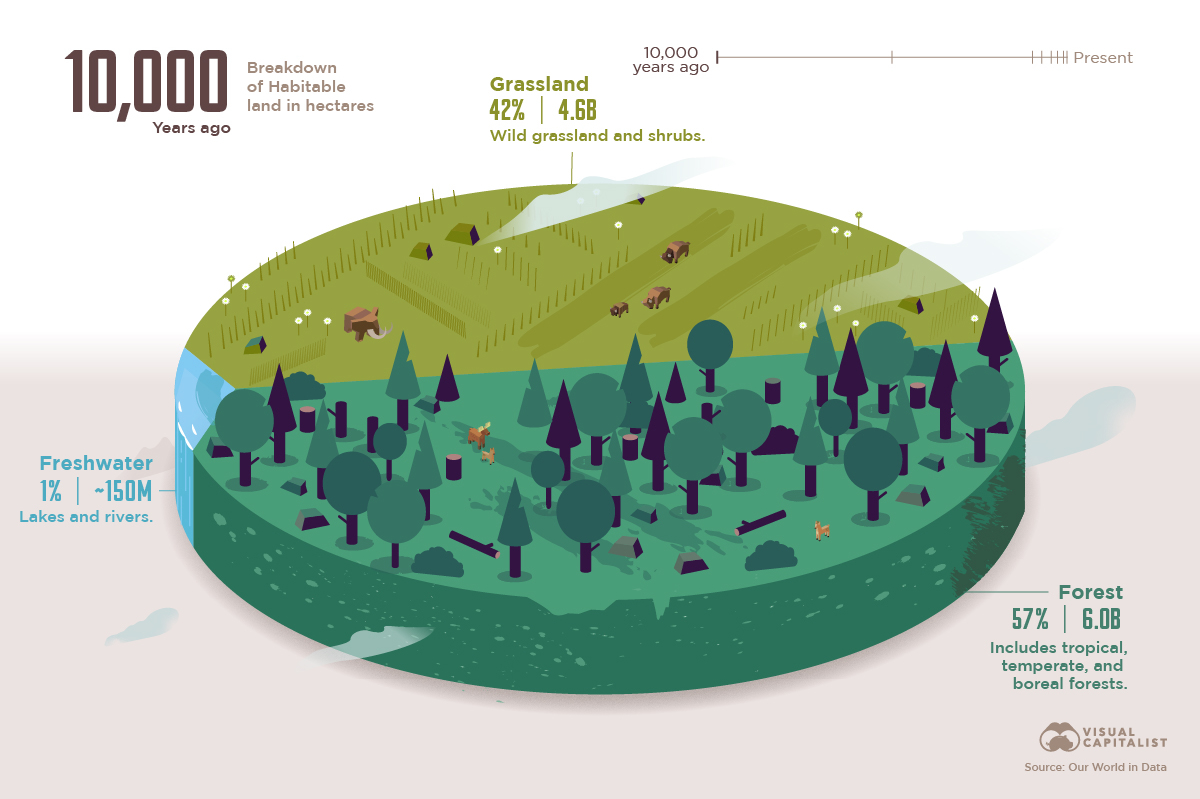
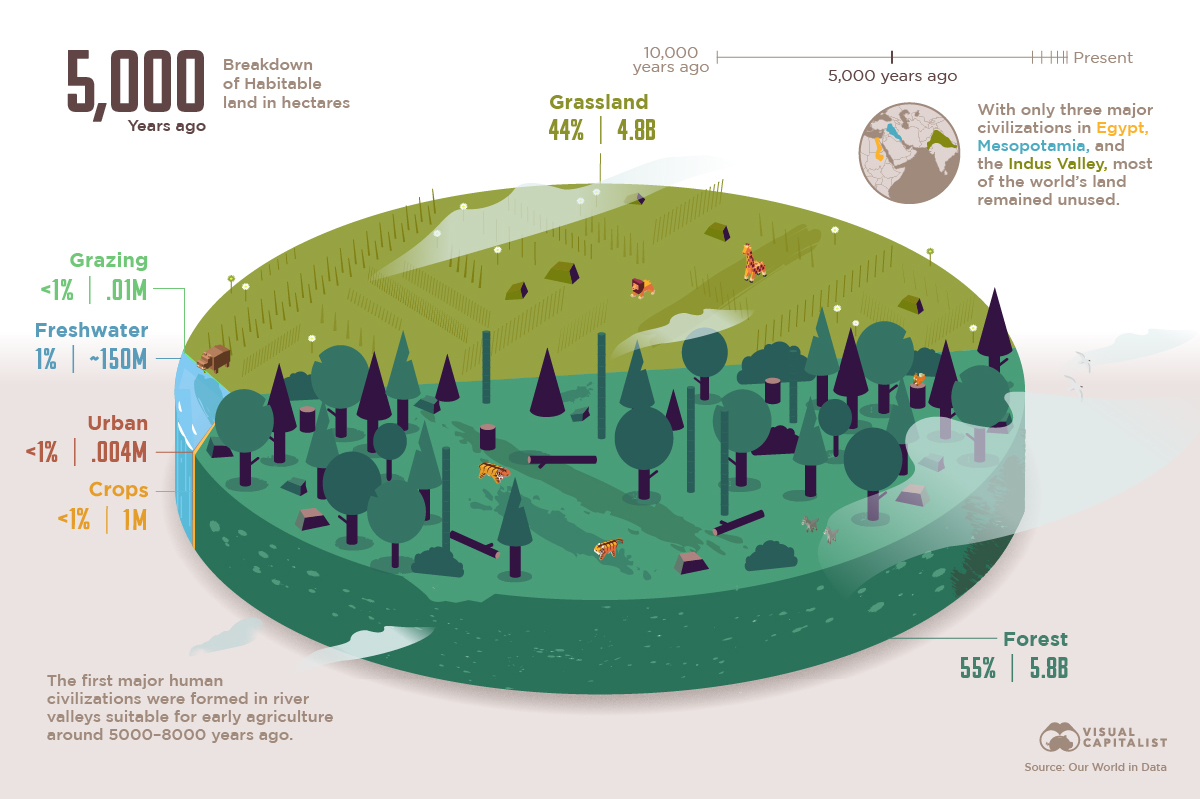
Visualizing the World’s Loss of Forests Since the Ice-Age
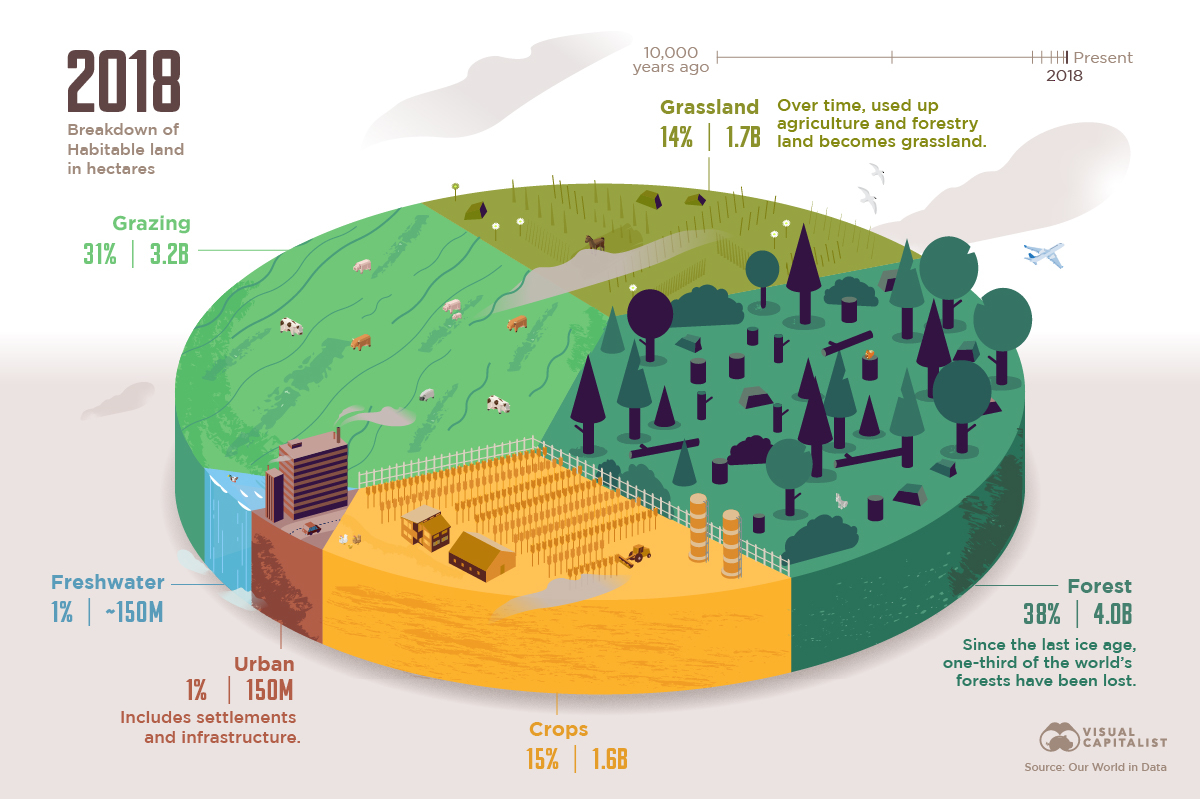
How much has the world’s land use changed over the last 10,000 years, and how have forests been impacted?.
First published: April 1, 2022 (link)
Source files included: .ai, .eps, .pdf
Data source: Our World in Data
A full license grants you the permission to download and modify our visualization, and to re-publish it in most professional and personal use cases.
Licenses also give you permission to translate our visualizations into another language, provided that you also remove the Visual Capitalist branding.
| Type of License | Full License (1 Credit) |
|---|

