
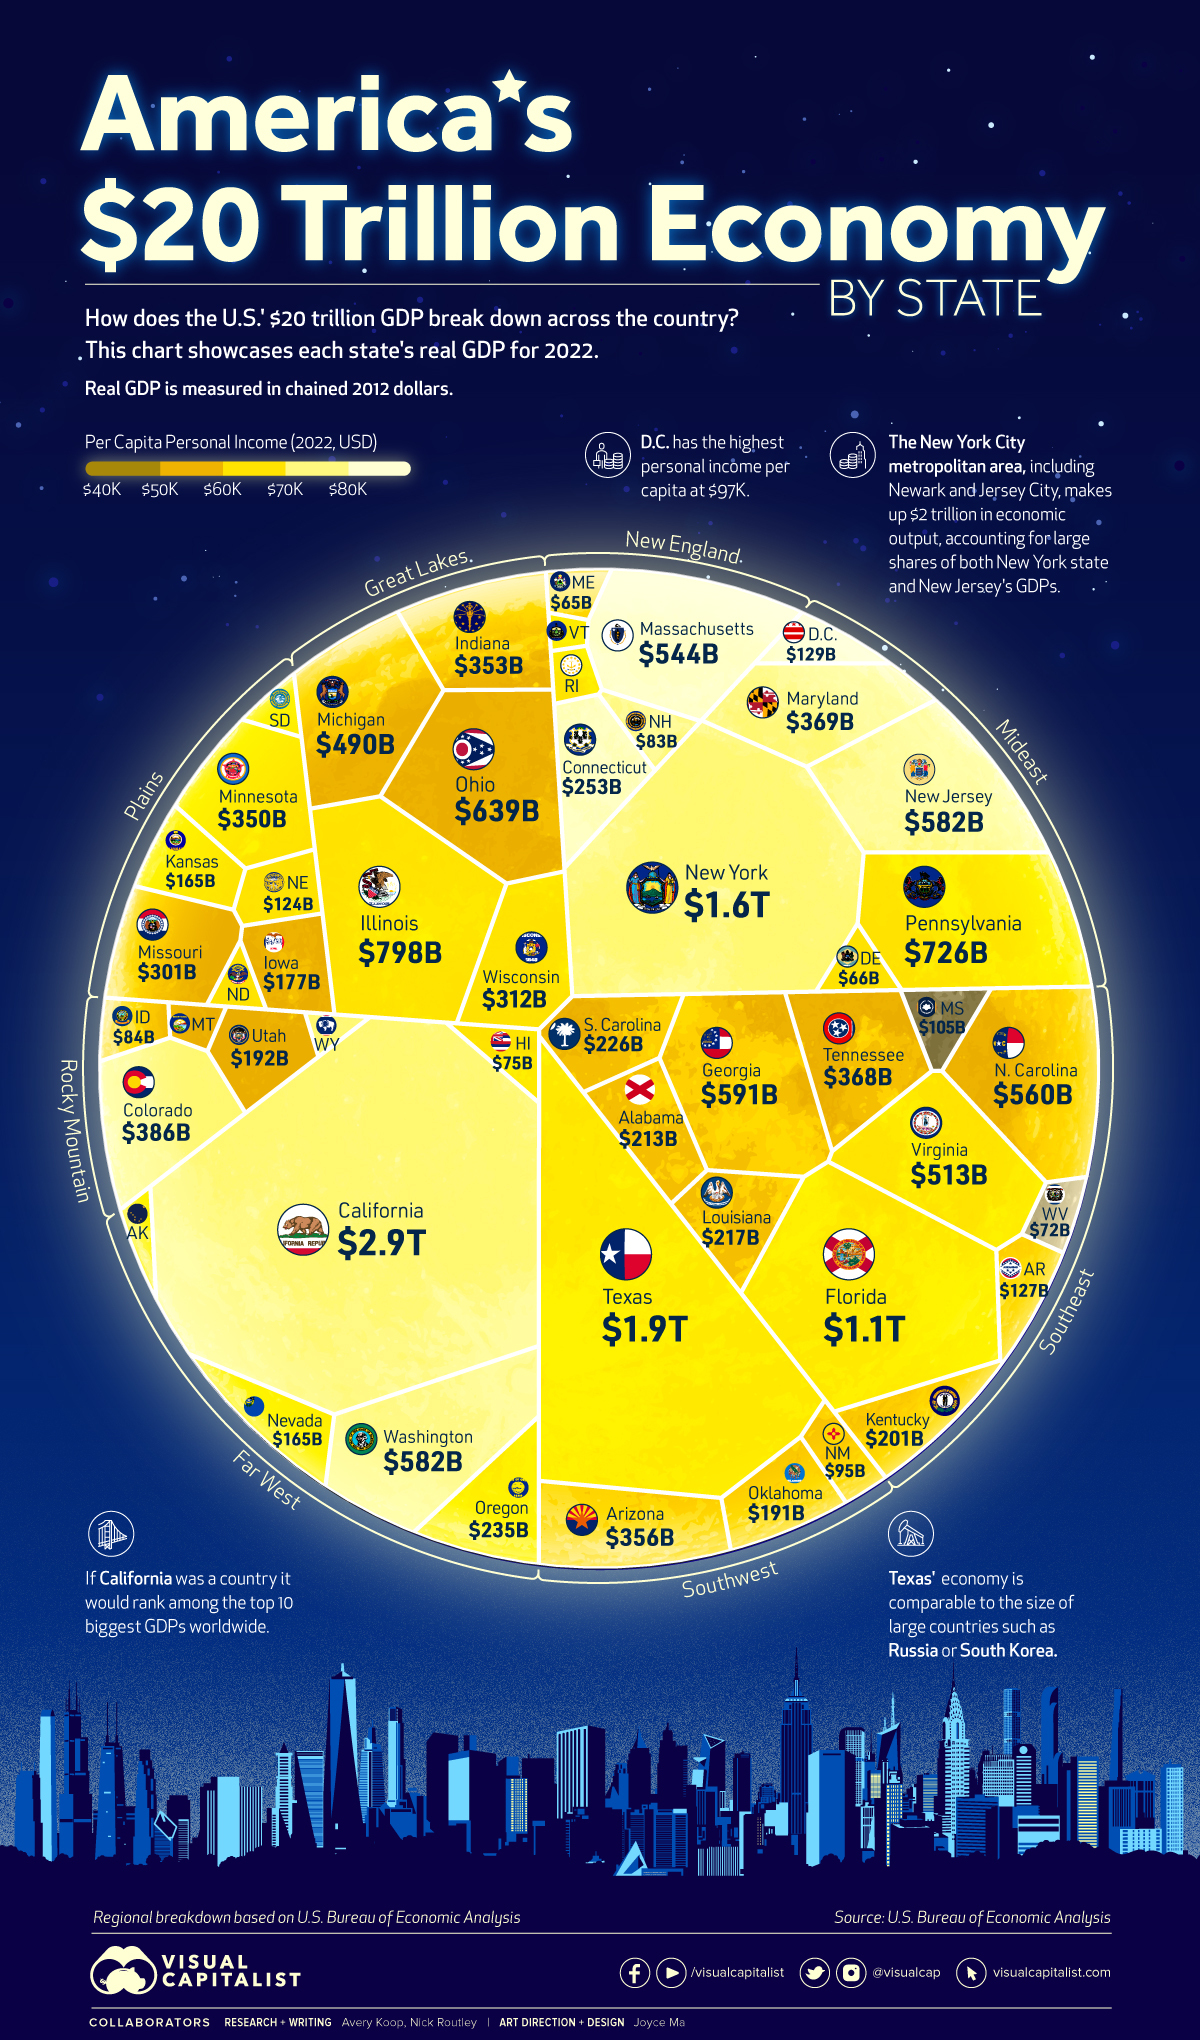
Visualized: The U.S. $20 Trillion Economy by State
How does each state contribute to America’s overall GDP? This visualization breaks down the U.S. economy by state.
First published: July 19, 2023 (link)
Source files included: .ai, .eps, .pdf
Data source: U.S. Bureau of Economic Analysis (BEA)
A full license grants you the permission to download and modify our visualization, and to re-publish it in most professional and personal use cases.
Licenses also give you permission to translate our visualizations into another language, provided that you also remove the Visual Capitalist branding.
| Type of License | Full License (1 Credit) |
|---|

