
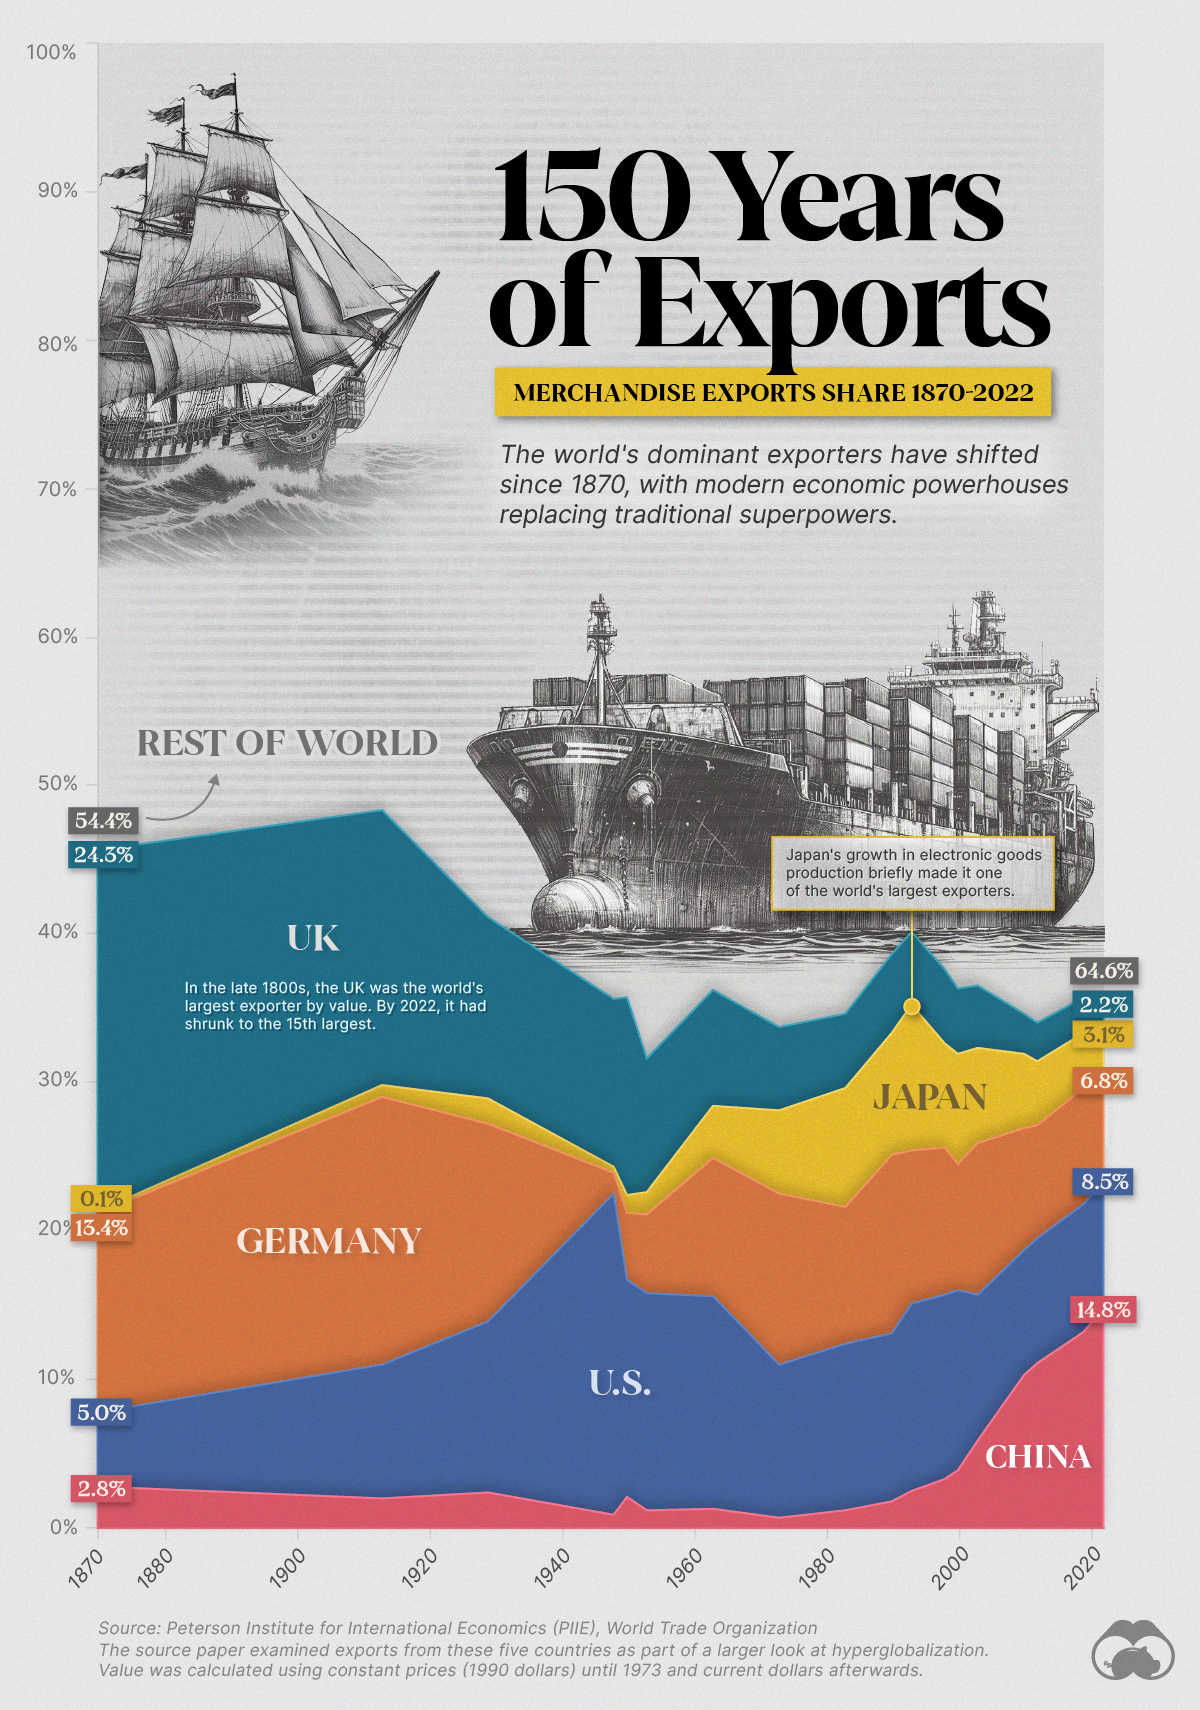
Visualizing 150 Years of Exports for Top Economic Superpowers
This graphic shows how global export shares by value have changed over the last 150 years. Today, China dominates the trade market, accounting for almost 15% of all merchandise.
First published: January 17, 2024 (link)
Source files included: .ai, .eps, .pdf
Data source: Peterson Institute for International Economics (PIIE) and the World Trade Organization
A full license grants you the permission to download and modify our visualization, and to re-publish it in most professional and personal use cases.
Licenses also give you permission to translate our visualizations into another language, provided that you also remove the Visual Capitalist branding.
| Type of License | Full License (1 Credit) |
|---|

