Visualizing the Economics of Coffee in One Chart
What goes into your morning cup of coffee, and what makes it possible?
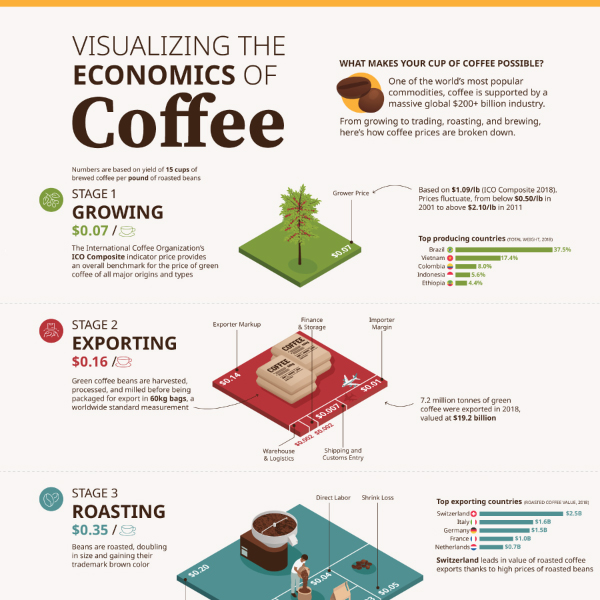
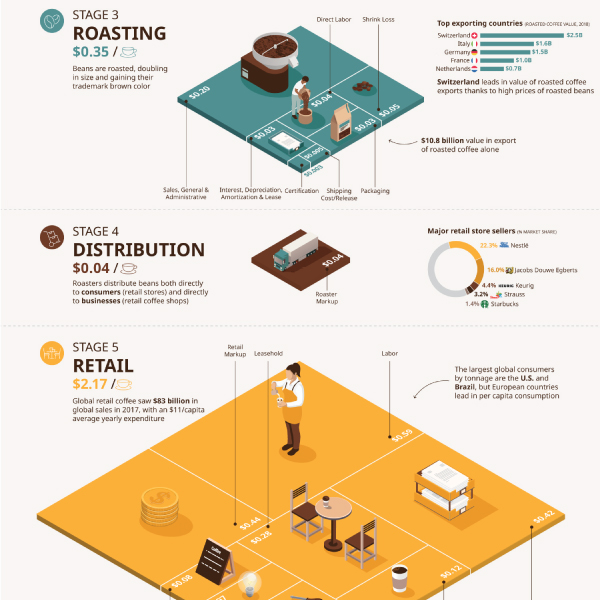
The obvious answer might be coffee beans, but when you start to account for additional costs, the scope of a massive $200+ billion coffee supply chain becomes clear.
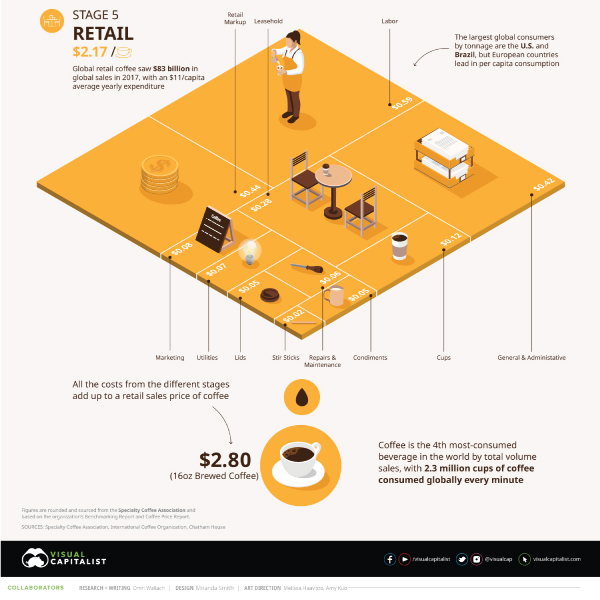
From the labor of growing, exporting, and roasting the coffee plants to the materials like packaging, cups, and even stir sticks, there are many underlying costs that factor into every cup of coffee consumed.
This infographic breaks down the costs incurred by retail coffee production for one pound of coffee, equivalent to about 15 cups of 16 ounce brewed coffee.
First published: October 24, 2020 (link)
Source files included: .ai, .eps, .pdf
Data source: Specialty Coffee Association, International Coffee Organization, Chatham House
A full license grants you the permission to download and modify our visualization, and to re-publish it in most professional and personal use cases.
Licenses also give you permission to translate our visualizations into another language, provided that you also remove the Visual Capitalist branding.
| Type of License | Full License (1 Credit) |
|---|


