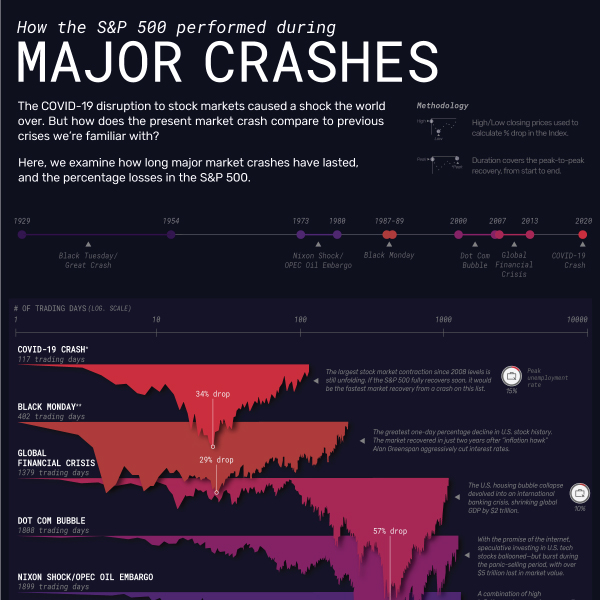
How the S&P 500 Performed During Major Market Crashes
Like spectacular market peaks, market crashes have been a persistent feature of the S&P 500 throughout time.
Still, the forces underpinning each rise and fall are often less clear. Take the COVID-19 crash, for example. Despite lagging economic growth and historic unemployment levels, the S&P 500 bounced back 47% in just five months, in a stunning reversal.
Drawing data from Macrotrends, this infographic compares six historic market crashes—examining the length of their recoveries and the contextual factors influencing their durations.
First published: August 5, 2020 (link)
Source files included: .ai, .eps, .pdf
Data source: Britannica, Investopedia, Bureau of Labor Statistics, University of Notre Dame, Washington Post
A full license grants you the permission to download and modify our visualization, and to re-publish it in most professional and personal use cases.
Licenses also give you permission to translate our visualizations into another language, provided that you also remove the Visual Capitalist branding.
| Type of License | Full License (1 Credit) |
|---|


